1. 의존성 추가
Spring Boot Actuator를 활성화하여 모니터링/관리할 수 있는 엔드포인트에 접속 할 수 있도록 해준다.
implementation 'org.springframework.boot:spring-boot-starter-actuator'
runtimeOnly 'io.micrometer:micrometer-registry-prometheus'
프로젝트를 실행하고, 다음 경로에 접속하자.
http://localhost:8080/actuator
8080 부분에는 본인 프로젝트의 서버 포트를 입력해주면 된다.
접속하면 다음과 같은 창이 뜬다.
Actuator가 현재 제공하는 엔드포인트를 확인할 수 있다.

2. application.yml 설정
actuator의 prometheus 엔드포인트를 활성화 시켜주기 위해서 application.yml에 다음을 작성한다.
management:
  endpoint:
    metrics:
      enabled: true
    prometheus:
      enabled: true
  endpoints:
    web:
      exposure:
        include: health, info, metrics, prometheus
  metrics:
    tags:
      application: ${spring.application.name}
다시 http://localhost:8080/actuator에 접속해보자.
prometheus 엔드포인트가 노출된 것을 확인할 수 있다.

3. Prometheus 설치
Prometheus를 로컬 PC에 설치할 수도 있지만, 필자는 도커를 사용하여 prometheus를 설치할 것이다.
prometheus.yml 설정
원하는 위치에 prometheus.yml 파일을 생성하고 다음 내용을 작성하자.
global:
  scrape_interval: 10s # 10초 마다 Metric을 Pulling
  evaluation_interval: 1m #1분 마다 규칙 평가
  external_labels: # 외부 시스템에 표시할 이 서버의 레이블
    monitor: 'my-app-monitor'
scrape_configs:
  - job_name: 'monitoring-app'
    metrics_path: '/actuator/prometheus'
    static_configs:
      - targets: ['host.docker.internal:8080']
필자는 도커와 8080 포트를 사용할 것이므로 "<my_spring_boot_app_ip>:<port>"는 'host.docker.internal:8080' 으로 적어주었다. host.docker.internal은 docker를 실행하는 host를 가리킨다.
이제 prometheus를 설치해보자.
터미널에 다음을 입력한다.
docker run -d -p 9090:9090 -v [prometheus.yml경로]:/etc/prometheus/prometheus.yml prom/prometheus
필자는 D 드라이브에 prometheus.yml 파일을 생성했기 때문에 다음과 같이 입력했다.
docker run -d -p 9090:9090 -v D:/prometheus.yml:/etc/prometheus/prometheus.yml prom/prometheus
pull이 완료되고 컨테이너가 실행됐다.

이제 localhost:9090에 접속해보자.
다음과 같이 prometheus 대시보드가 뜬다.

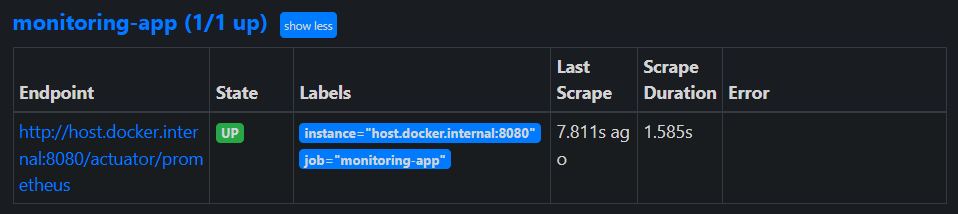
Status > targets로 이동해서 내가 설정한 job이 모니터링 타겟으로 제대로 등록 되었는지 확인하자.
4. Grafana 설치
터미널에 다음을 입력한다.
docker run --name grafana -d -p 3000:3000 grafana/grafana
Grafana 컨테이너도 정상적으로 실행되었다.

localhost:3000으로 접속해보자.
다음과 같은 창이 뜬다.
초기 username과 password는 admin, admin이다. 로그인하면 새로운 password를 설정할 수도 있고, skip할 수도 있다.

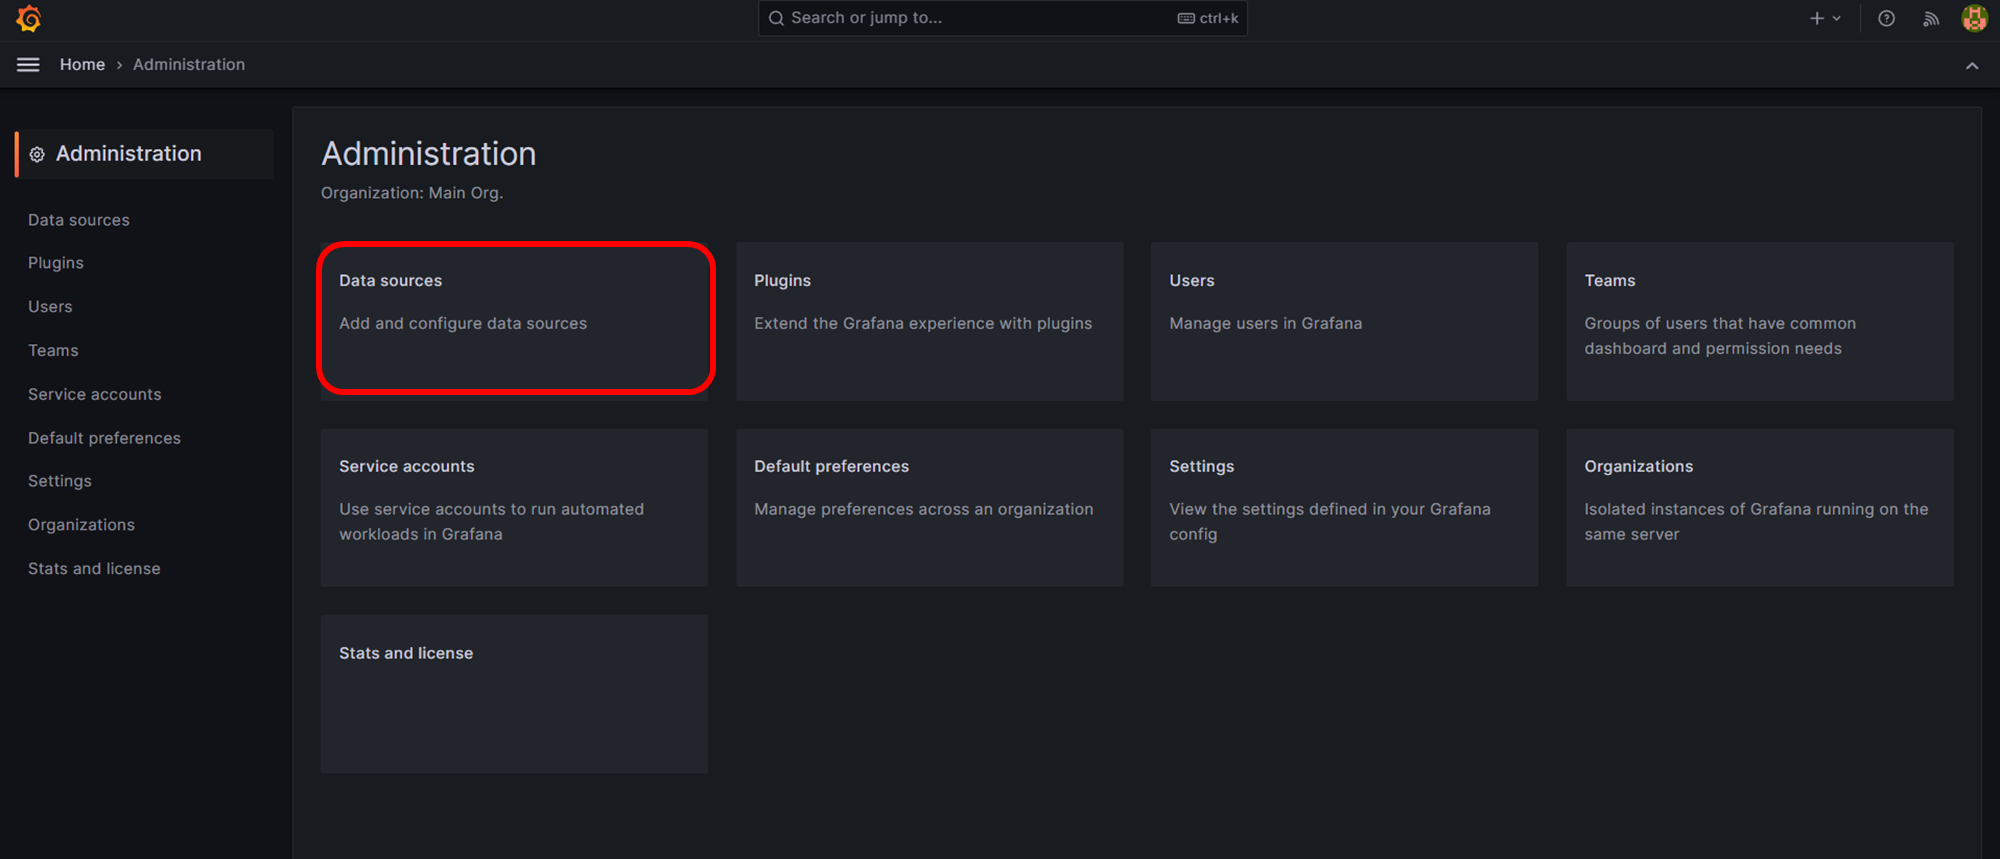
좌측 상단의 메뉴를 열어서 Administraion을 클릭한다.

Data sources를 클릭한다.
Add data source 버튼을 클릭하자. Choose a data source type에서 Prometheus를 선택한다.
필자는 url에 http://host.docker.internal:9090 을 적어주고 나머지는 모두 디폴트 설정으로 하고 Save & test를 클릭했다.
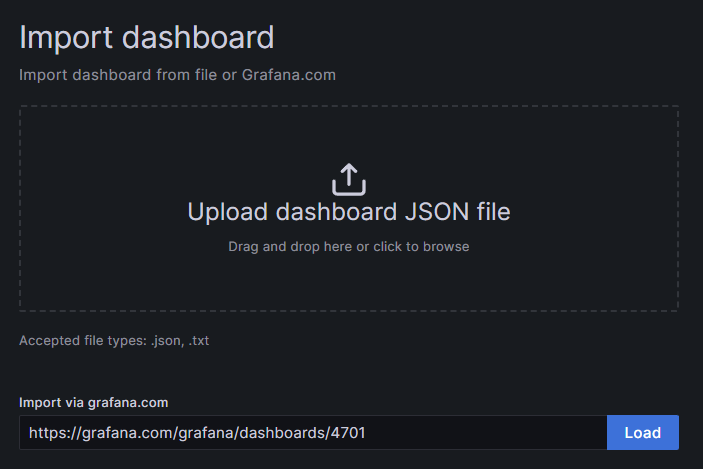
이제 대시 보드를 생성할 것인데, SpringBoot 메트릭을 보여주는 JVM (Micrometer)가 있으므로 이걸 가져와 사용해보도록 하겠다.

Import via grafana.com에 다음과 같이 입력하고 Load한다.
https://grafana.com/grafana/dashboards/4701
Prometheus를 설정해주고 Import 한다.

prometheus와 grafana가 연결되었다.

'Spring' 카테고리의 다른 글
| [Spring] SpringBoot K6 + Grafana 부하 테스트 및 모니터링 (0) | 2023.05.29 |
|---|---|
| [Spring] Jacoco 적용하여 코드 커버리지 확인 및 Codecov사용한 PR에 커버리지 코멘트 추가 (0) | 2023.05.27 |
| [Spring] Spring WebFlux 간단한 예제 (0) | 2023.05.25 |
| [Spring] @RequestParam으로 Enum 타입 매개변수 받기 (0) | 2023.05.15 |
| [Spring] @RequestPart 사용하여 MultipartFile과 Dto 함께 받기, Postman 테스트 (0) | 2023.05.14 |